Reliability Tools and Methods for Program or Project Development and Validation processes.
Introduction.
In all ISO 9000 standard certified companies, a certain Quality Program is at place, describing the process steps that are to be taken during the development of new products. Apart from the ISO steps, one of the upcoming quality programs is DFSS or Design For Six Sigma that is based on the Six-Sigma Quality Program for improving the Quality of the current Products and Processes.
This page gives an overview of possible Reliability Tools and Methods that can be used during a Program Development Process.
This as Reliability Tools and Methods do have a strong relation with the Quality Program sequential phases in a project. On this page the DFSS phases are used as a typical timeline, but they can easily be replaced by ISO 9000 or other Quality Program steps.
The DFSS steps or phases in a program are:
IDENTIFY – DEFINE – DESIGN – OPTIMIZE – VALIDATE – CONTROL
All Tools listed are taught in the Weibull Reliability Engineering Workshop.
|
Content:
|
|
|
Identify phase :
|
Opportunities
|
|
Define phase:
|
Program Target
|
|
Design phase :
|
Project Test-plan Field Test |
|
Optimize phase :
|
FMEA (Failure Mode and Effect Analysis) Reliability Validation Planning DVP&R (Design Validation Plan & Report) |
|
Validate phase :
|
FRACAS & FRB(Failure Report and Corrective Action System)(Failure Review Board)
Crow-AMSAA (Reliability Growth) Weibull Analysis Reliability Forecast |
|
Control phase :
|
Field Reliability Data
|
General:
The major recommendations for a successful implementation of Reliability Optimize in the Design process are:
1 – Assign a full-time Dedicated Program Reliability Engineer to each program. His task is to implement, facilitate and execute all methods and tools during the program, including reporting to the senior staff.
2 – Assure that specific Reliability related deliverables for Project Tollgates are defined and create standard reports for them.
3 – Organize that ALL FAILURES are registrated and are assessed by a Failure Review Board (FRB). This to assure that no failure is called an Incident.
Bann the “I”-Word… …
For this purpose, a system that lists and tracks all failures identified is required, combined with a formal Review Board with as permanent member the Program Reliability Engineer.
4 – Organize that the Program Reliability Engineer reports on frequent periods to the senior staff on the Reliability status of the project. This creates the required focus to implement all the relative new tools and methods within the program and gives the management team the power to initiate corrective actions in time and measure the results of them.
5 – Decide to use all tools and methods available as presented in this page during a program. There is no reason known to my knowledge to skip one of them. There will probably be better and more advanced tools available during the program development time as RM&S (Reliability, Maintainability & Safety) is still an upcoming discipline in development departments. If you see the need for other / better tools, develop them and use them in your next project update on Reliability!
What Tool/Method is available for what stage of the program?
Per program status in time, different tools and methods are developed and recommended. Some of them are pretty sophisticated and mend for the Program Reliability Engineer only. Others are mend for designers and/or testing personal working on the program, but will sometimes need facilitating by the Program Reliability Engineer.
All tools will require educational actions supplied by the Program Reliability engineer.
Identify phase; Opportunities
Objective:
Identify the current systems and components that function far below their reliability requirements and can be proposed to be part of the program content. The effectiveness of the program reliability improvement can be maximized.
Method/Tools:
• Warranty / R&M Contract Costs analysis.
• Field Reliability Data analysis.
Process:
1. Define the top non-performing systems of the current program.
Use all the data available, like:
• Warranty Data
• Field Reliability Data
• R&M (Repair and Maintenance) Contracts Data
2. Report to Program Manager / Chief-Engineer and advice on adding the issues to the program, showing the possible trade-off.
3. Decide to add the issues on top of the initial program content.
Deliverables:
• List of non-performing systems / components, including required improvement per issue.
• Quantify the impact on the overall reliability performance of the program by adding these issues.
Reporting / Tracking:
Sample report
|
Issue: System/Component
|
Current performance
|
Target
|
Required improvement
|
Main
Failure-Mode |
|
1
|
10% @ 2 yr
|
1% @ 2 yr
|
Factor 10
|
Wear-out
|
|
2
|
25% @ 4 yr
|
5 % @ 4 yr
|
Factor 5
|
Corrosion
|
|
3
|
5 % @ 1 yr
|
0,2% @ 1 yr
|
Factor 25
|
Fatigue
|
|
4
|
%
|
%
|
Factor 2,5
|
Wear
|
|
5
|
%
|
%
|
Factor 3
|
Water ingress
|
|
6
|
%
|
%
|
Factor 10
|
.
|
|
7
|
%
|
%
|
Factor 6
|
.
|
|
8
|
%
|
%
|
Factor 30
|
.
|
|
9
|
.
|
%
|
Factor 4
|
.
|
|
10
|
.
|
%
|
Factor 5
|
.
|
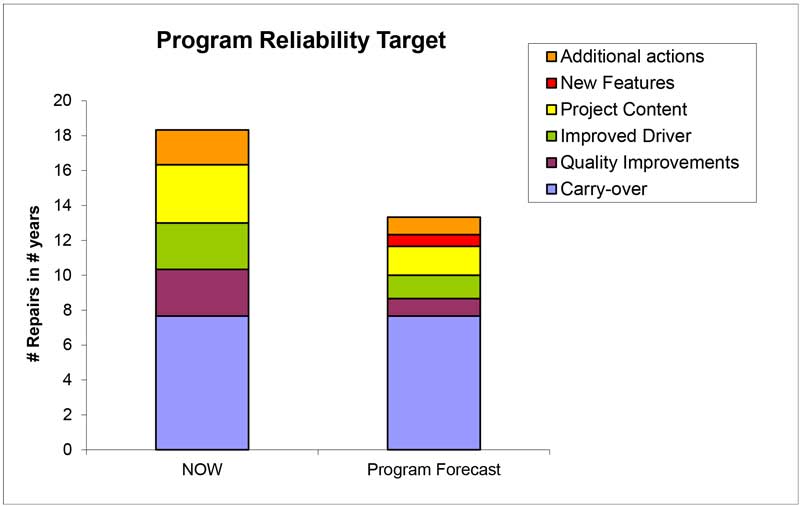
Define phase (I); Program Target
Objective:
Assure that the Program Reliability Target is feasible and can be met with all design and validation activities planned.
Method/Tools:
• Warranty / R&M or Field Reliability Data analysis if available.
• Project Reliability Target Sheet.
• System Target Calculator.
• Generic Reliability Targets / Company guidelines.
Process:
1. Define the current performance of the systems that are affected by the program.
2. Determine the appropriate Reliability Target for these systems, using the generic targets or other Company guidelines.
3. Assure that these new (sharper) targets are feasible and realistic. (State of the art & designer estimations on this aspect!)
4. Define if other activities are required to meet the overall Program Reliability Target.
5. If so, define these issues and set appropriate targets.
6. Report to Program Manager / Chief-Engineer and advice on adding the additional activities to the program.
7. Final decision on Program Reliability Target.
Deliverables:
• Estimation of the program Reliability Target feasibility.
• Overview current performance, program content + additional activities related to the Program Reliability Target, expressed in number of repairs.
Define phase (II); Set Specifications
Objective:
Assure that the defined specific System and Component Reliability Targets (and Warranty Targets) are clear for all designers and suppliers.
Method/Tools:
• Specifications
• Generic Reliability Targets / In-Company guidelines
• System Reliability Target Sheet
Process:
1. Determine the detailed Reliability targets per component, system or cluster of components using the guidelines.
2. Assure that these new targets are feasible / realistic.
3. Define the targets in Specifications and communicate these to the appropriate suppliers and all others that are involved.
4. Report how many specifications are required and the status of creating them. Also assure that the specifications are part of the supplier development contracts and understood by both the purchaser and the supplier.
Deliverables:
• Detailed Reliability Targets per system / component.
• Specifications with the Reliability targets clearly stated in them.
Reporting / Tracking:
Simple Time tracking graph’s will do for reporting.
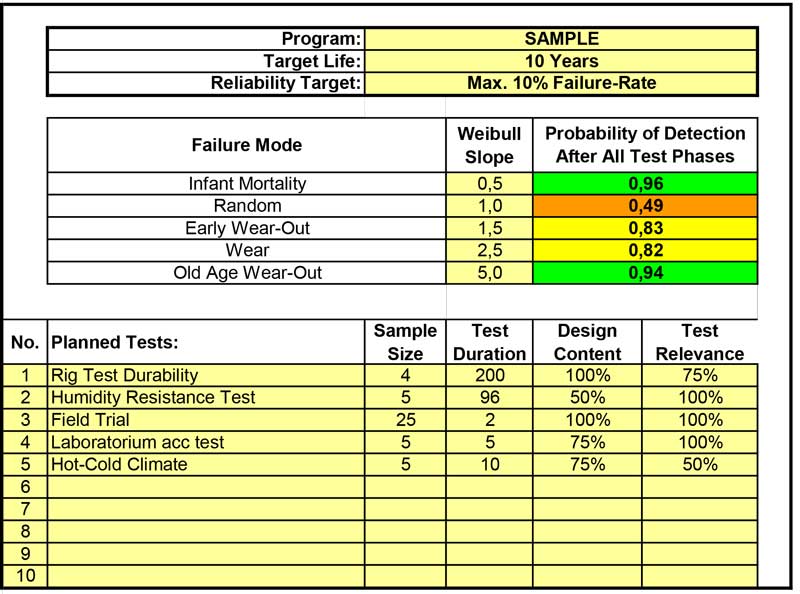
Design phase (I); Project Test-Plan
Objective:
Create an overall testing plan that assures a sufficient probability of detecting failure-modes during the program validation taking all generic failure-modes in account.
Method/Tools:
• Project Testing Plan Calculator
Process:
1. Define what tests; bench-tests, lab-tests, customer trials, field-test etc. are initially planned for the program.
2. Determine what the probability of detecting failure-modes is with all tests planned.
3. Define how many tests and of what duration and sample-size are required to get the desired probability (90%) of detecting all generic failure-modes.
Deliverables:
• Spreadsheet showing on a high level all tests planned resulting in the probability of detecting different failure-modes.
• Proper overall program testing plan.
Reporting / Tracking:
Overall testing plan, expressed in Probability of detecting Failure-modes with all test planned. Simple graphs can be used for reporting the calculated numbers.
Design phase (II); Field-test
Objective:
Create a field-test plan that assures a sufficient probability of detecting Infant-Mortality (=Process related) and Random (=Customer usage related) failure-modes during the program validation.
Method/Tools:
• Field-test calculator
Process:
1. Define what field-test (length and sample-size) are initially planned for the program.
2. Determine what the probability of detecting failure-modes is with all tests planned.
3. Define the minimal sample-size and the duration of the field-test to assure detection with the required probability (90%) of Infant-Mortality and Random Failures.
Deliverables:
• Detailed plot showing relation between sample-size, test-length, different failure-modes and probability of detecting.
• Early decision on Field-test size and time.
Reporting / Tracking:
Graphical plot of probability detecting failures depending on test time, B-life’s and sample sizes.
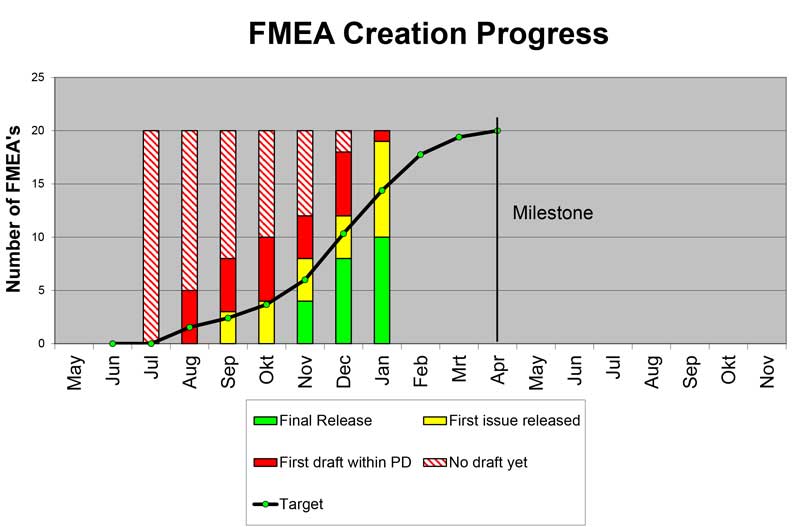
Optimize phase (I); FMEA / FTA
Objective:
Create a proper Risk Analysis based on the program content defined.
Method/Tools:
• FMEA (Failure Mode and Effect Analysis)
• For Systems a FTA (Fault Tree Analysis) can be appropriate.
Process:
1. Decide for what items a detailed Risk Analysis is required.
2. Determine, using the FMEA methodology, the main risks and their effects + risk reduction activities of the program.
3. Note that this is a multi-disciplinary team effort to estimate all risks in a new component and/or system.
4. Assure that new discovered failure-modes and risk-reduction activities are added to the existing FMEA to assure proper risk reduction tracking.
5. For selected systems, create a Fault-Tree-Analysis (FTA) and quantify the probability of failure and risk reduction actions.
Deliverables:
• Detailed FMEA’s on all selected aspects (Systems and Components) of the Program.
• FTA’s showing what system Reliability performance can be expected and what the main drivers in the system related to reliability are.
Reporting / Tracking:
Simple Time tracking graph’s will do for reporting.
Optimize phase (II);
Objective:
Assure that all activities planned in the FMEA to reduce the risk are indeed enough for proper risk reduction. (Risk Quantification)
Method/Tools:
• Reliability Validation Planning
Process:
1. Determine from all FMEA’s what the top risk failure-modes are, related to Reliability.
2. Create a detailed Reliability Validation Plan per issue, using all tests planned, both by supplier and your self.
3. Assure that all non-testing (Engineering) activities are integrated
4. Adjust the FMEA with the results , mostly different tests then first estimated or other, very specific activities.
Deliverables:
• Detailed action-plans per system / component, showing with what Confidence we can make the Reliability Target.
• Full focus on major Program risks as indicated in the FMEA’s, plus a proper risk reduction plan per issue.
• Cleary visible Supplier involvement in risk reduction plan activities.
Reporting / Tracking:
Simple Time tracking graph’s will do for reporting.
Optimize + Validate phase(III); DVP&R
Objective:
Measure and track the risk reduction in time during the program.
Method/Tools:
• DVP&R (Design Validation Plan and Report).
Process:
1. List all risk reduction activities from the FMEA’s in a time-tracking overview.
2. Allocate risk reduction numbers to the activities, based on the FMEA calculation results.
3. Add planning dates to all activities.
4. Track the risk reduction in time, assure that new activities are added to the overall plan the moment new failure-modes occur.
Deliverables:
• Overview DVP&R sheets per project plus lists of planned activities per department / supplier
• Overall program risk reduction tracking graph.
Reporting / Tracking:
![]()
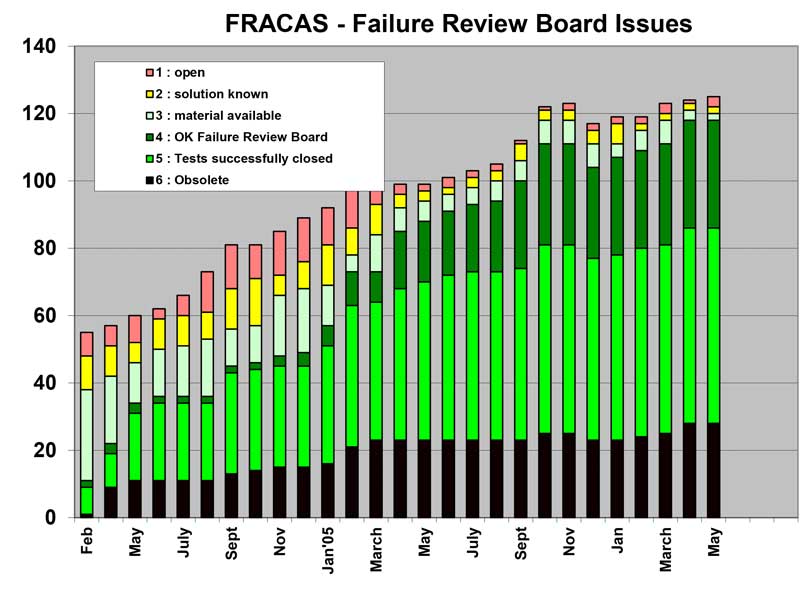
Validate phase (I); FRACAS & FRB
Objective:
Assure that all failures identified are clearly reported and tracked from first occurrence to final validation of the solution. None of the failures will be treated as an Incident.
Method/Tools:
• FRACAS (Failure Report And Corrective Action System) or similar list of failures identified.
• FRB (Failure Review Board) that reviews all issues frequently
Process:
1. Report all failures identified during validation (testing) in a central database.
2. Each issue requires a unique tracking number and severity indication (Category).
3. Frequently review the status per item in the FRB. The Reliability Engineer plays an important roll in this team!
4. Assure that per issue a frequent status update is reported. Typical milestones used during this process are:
1 – Open, no solution known; 2 – Solution available, not validated; 3 – Material available, Validation running; 4 – OK Failure Review Board; 5 – Tests closed; 6 – Obsolete
Reporting / Tracking:
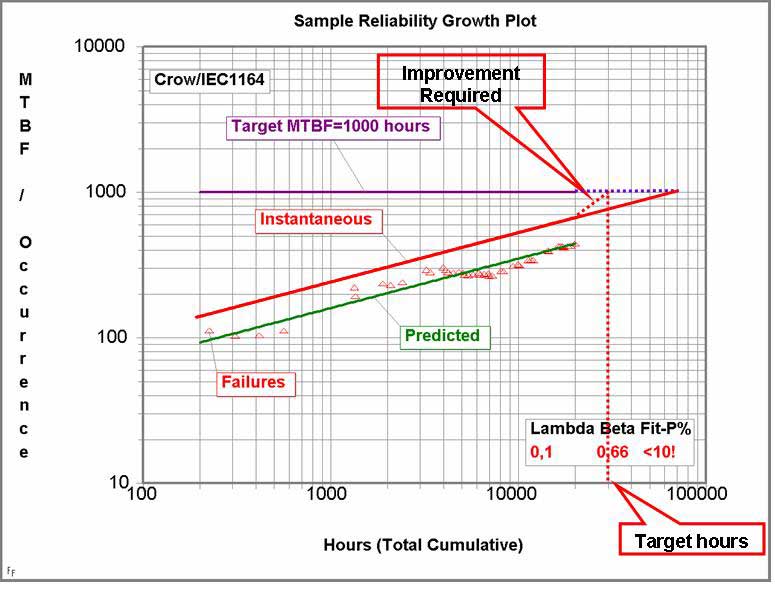
Validate phase (II); Crow-AMSAA Reliability Growth
Objective:
Measure the Reliability Growth of the overall program during the validation process. Monitor the Problem Solving Process, expressed in PSR (Problem Solving Rate) or Reliability Growth (APLHA) values, thus monitoring the product development improvement process.
Method/Tools:
• Crow-AMSAA Reliability Growth
Process:
1. Determine the Reliability growth by plotting cumulative failures against cumulative time, miles or cycles.
2. Create the MTBF plot and extrapolate to the end of validation phase.
Deliverables:
• Crow-AMSAA MTBF plots, including target-lines and PSR values.
• PSR value development during the validation program.
Reporting / Tracking:
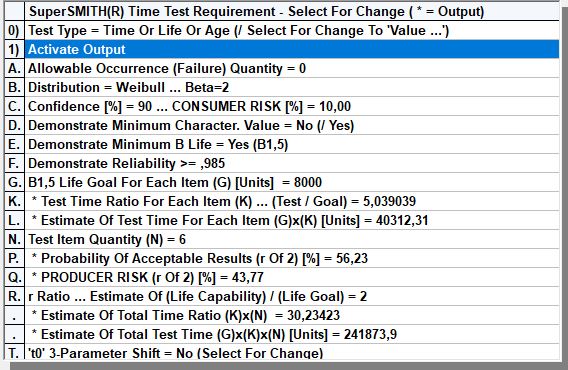
Validate phase (III); Weibull Analysis
Objective:
Measure the current Reliability performance of components, the moment failures occur during testing. Determine the required improvement factor to meet the requirements and set-up adequate recovery validation plans.
Method/Tools:
• Weibull / Weibayes Analysis
Process:
1. Determine Reliability performance of (failing) component under study, including the required improvement factor.
2. Create correlation between test-rig and field-performance of current design by testing the current design first on an accelerated test-rig.
3. Decide what testing method (zero-failures / zero-one failures, testing to failure etc) is most appropriate.
4. Define optimal recovery plan for the new design, including sample-size and minimal testing time.
Deliverables:
• Detailed recovery plans for components that show failures during the validation process.
Reporting / Tracking:
Sample:
Zero-failure testing plan calculations resulting in minimal testing time depending on required confidence, available sample-size, Reliability Target and life requirement Target.
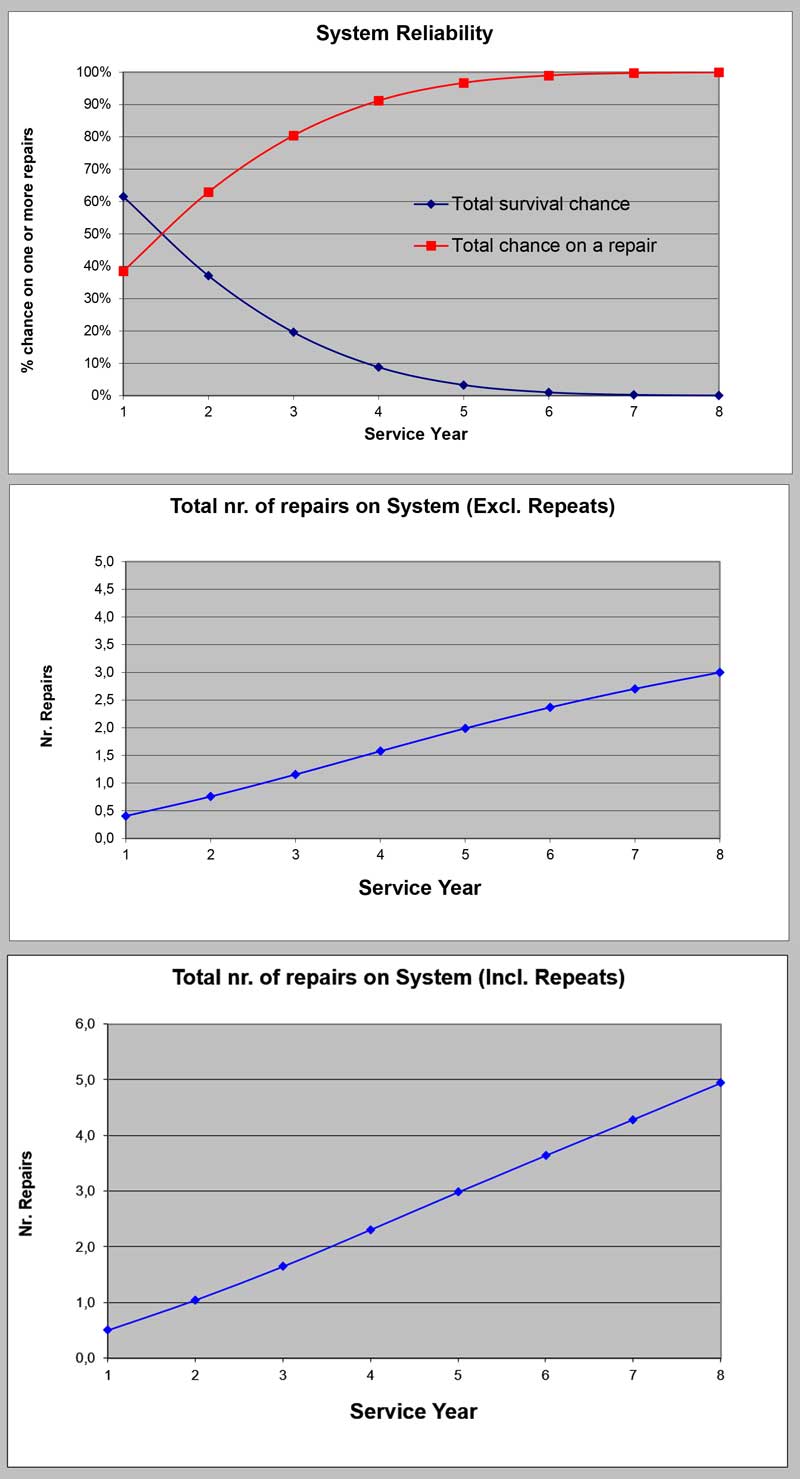
Validate phase (IV); Reliability Forecast
Objective:
Forecast the overall Program Reliability performance at introduction to the customer.
Method/Tools:
Reliability Forecast Spreadsheet
Crow-AMSAA plots
Weibull analysis
Process:
1. Determine Reliability performance of all component and systems in the program, using all data available.
2. Combine all above in the Program Reliability Forecast spreadsheet to forecast the overall program Reliability performance.
3. Combine this with the non-program issues to create the overall system Reliability forecast.
4. Use Confidence intervals for sensitivity analysis if required.
Deliverables:
• Sub-system, component and overall system reliability forecasts.
• Sensitivity analysis if required.
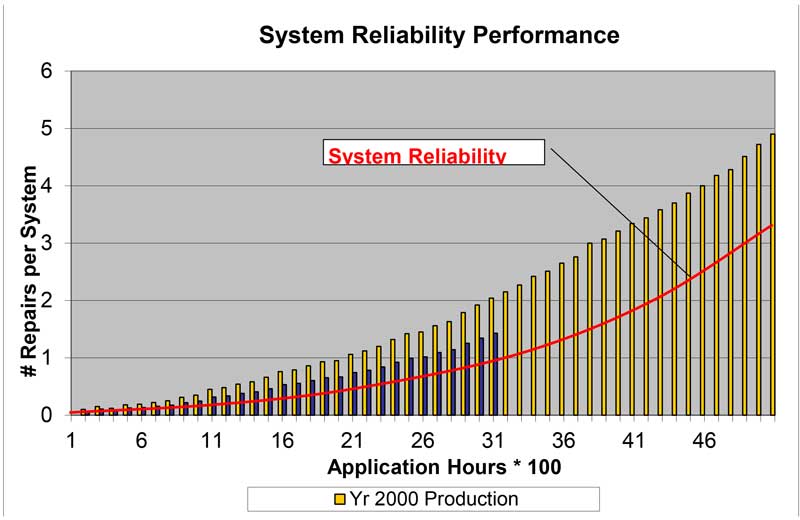
Reporting / Tracking:
System sample forecast.
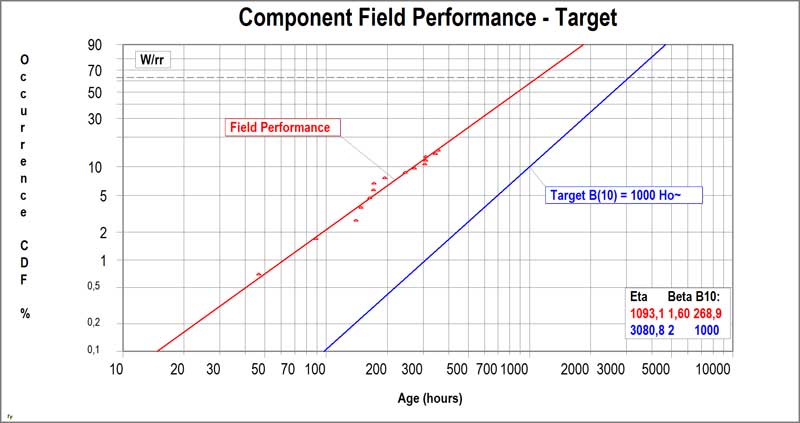
Control phase; Field Reliability Data
Objective:
• Validate Reliability of new products related to the target set.
• Measure long life Reliability on Systems, Sub-systems & Components.
• Correlation of tests with real-world environment.
• Competitive Reliability performance.
Method/Tools:
• Field Reliability Data
Note that this is not the same as the Warranty analysis.
Process:
1. Determine sample size and tracking time.
2. Select and visit customers to gather the required data + failed parts.
3. Translate and import data in your database.
4. Analyze and report Reliability performance.
5. Initiate corrective actions if required.
Deliverables:
• Detailed plots on field Reliability performance.
• Split-up to severity where required.
• Weibull plots of components.
• Benchmark performance is possible.
Reporting / Tracking:
All methods mentioned above plus some new ones are part of the
Weibull Reliability Engineering Workshop
