The effects of Components or Systems UN-Reliability that organizations are confronted with, are increasing in number, complexity and seriousness. The customer expects more than the odd one or two year Warranty and has a certain Life Expectation of the product. Not only the usual one or two year Warranty Costs, but also the Product (and Company) Image damage have to be taken in account when Reliability Targets are set.
RMS (Reliability Maintenance & Safety) Engineering is an upcoming discipline within Product Development, due to the new methods developed the last years. Weibull Analysis is one of the most progressive methods in these, as the unique power of Weibull Analysis supports:
|
· Design, Development, Process, Production and Service Analysis.
|
|
· Modeling of the Product’s Durability and Reliability.
|
|
· Evaluation and design of maintenance planning.
|
|
· Analysis of Inspection data or data that is not complete.
|
|
· Reduction of Test-Time, Sample-size, Costs.
|
The renewed methods and techniques give reliable results, even with an extreme small sample size, dirty data, field data, or incomplete data. Special methods are developed for several different kinds of data. The most applicable method for your kind of data is easily found by using the “Best Practice” flowchart, as offered in the SuperSMITH Weibull Software.
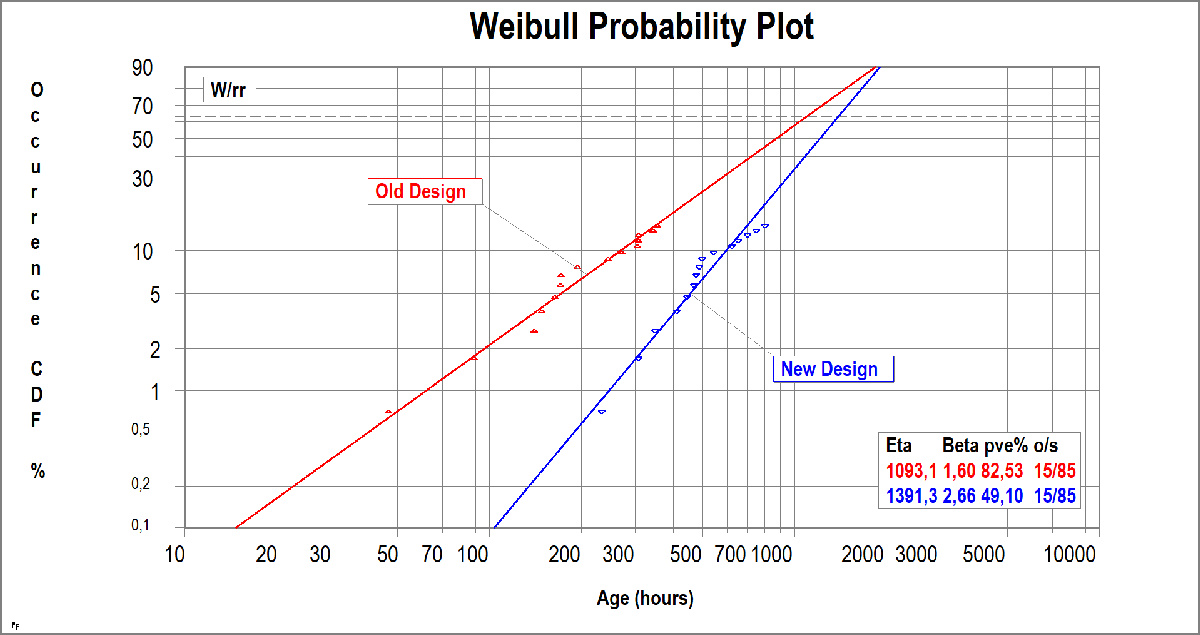
The Weibull plot can easily be interpret by Engineers and Managers as the plot is a straight line on Log/Probability paper. Extrapolation is as easy as drawing a straight line on the plot.