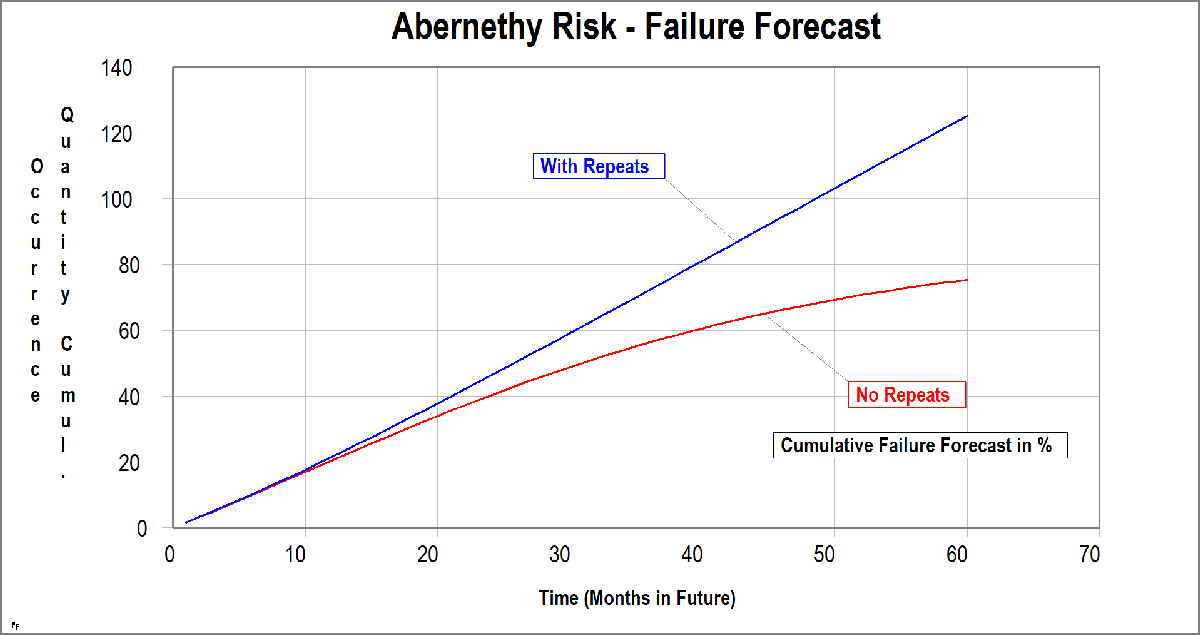
Apart from reading the extrapolated % failures from the Weibull plot, Failure Forecasting can be shown in different plots. The interpretation of the graphs is simple. Both with and without repeats can be shown in the same plot.
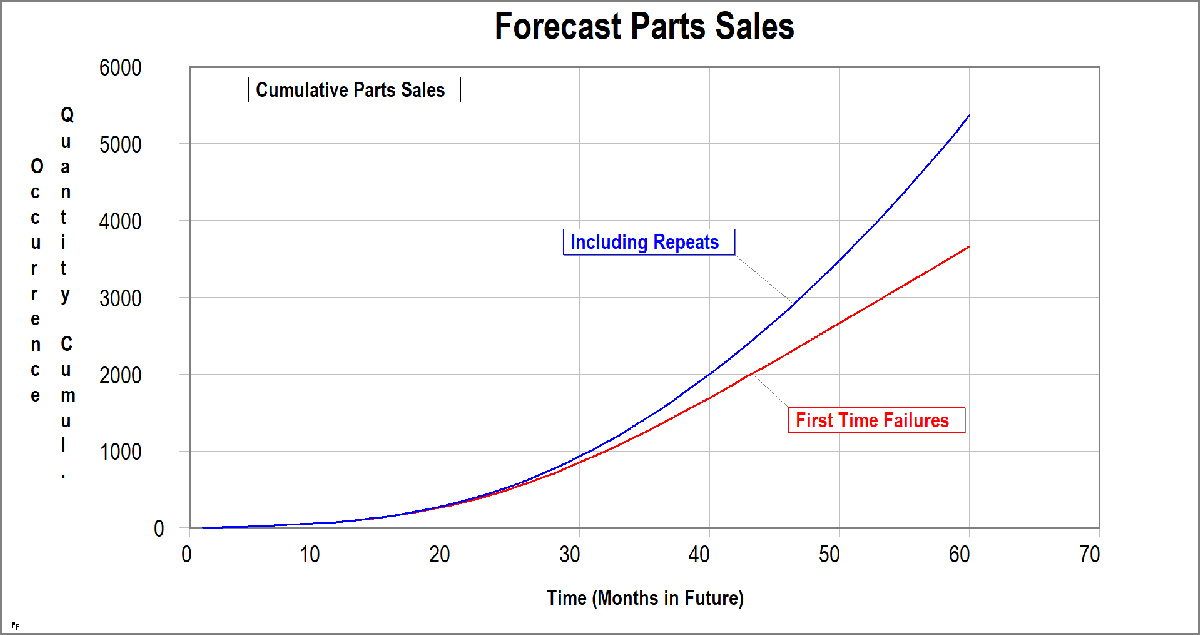
Forecast PARTS Sales
Forecast PARTS Sales is almost always interesting. The moment the Costs per replacement are known, the plot can be transformed into Costs in Euro’s, Dollars or any other currency for the upcoming months, years or even further ahead.